About Dot Plot Maker
Dot plot maker is an online chart generator tool that creates a dot plot or a dot chart.
A dot chart or a dot plot is a simple statistical chart consisting of data points plotted on a fairly simple scale, typically using filled in circles. They are one of the most simplest chart and used to demonstrate small to medium size data sets.
Example
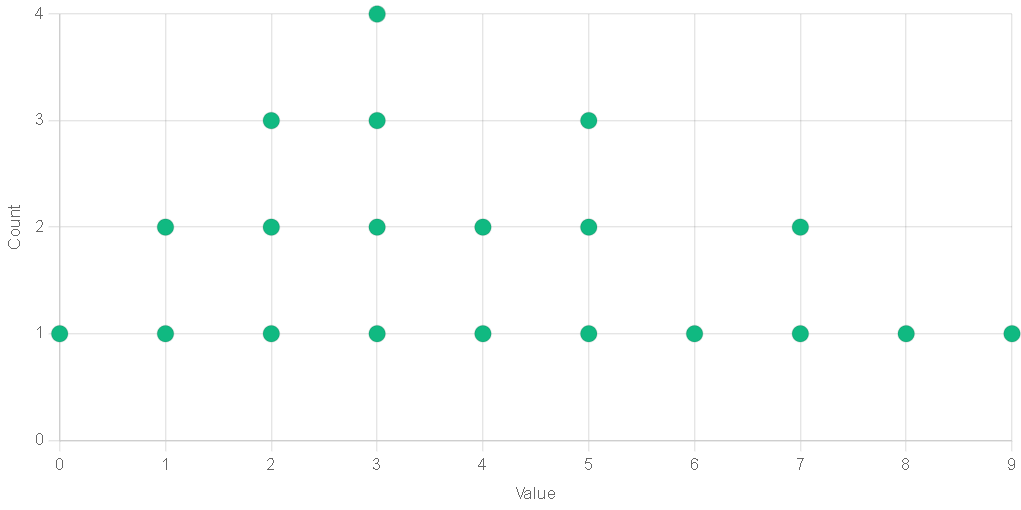
Let's understand the dot plot with a simple example. Suppose you ask 20 people how many kilometers they walk on average everyday. Thier answer (in km) are:
0, 1, 1, 2, 2, 2, 3, 3, 3, 3, 4, 4, 5, 5, 5, 6, 7, 7, 8, 9
| Kilometers Walked | People |
|---|---|
| 0 | 1 |
| 1 | 2 |
| 2 | 3 |
| 3 | 4 |
| 4 | 2 |
| 5 | 3 |
| 6 | 1 |
| 7 | 2 |
| 8 | 1 |
| 9 | 1 |
It means that 1 people walked 0 km (means they did not walk at all), 2 people walked 1 km daily, 3 people walked 2 km daily and so on.
Here is the dot plot:
| Data | Value |
|---|---|
| Mean | 4.5 KM |
| Median | 3.5 KM |
| Standard Deviation | 2.58 KM |